Case study
Network Threat Explorer
Suricata events from a packet capture become statistics, machine-learning-flagged anomalies and a written security assessment.
CSE prize, Hack the North 2025
The problem
The Communications Security Establishment's Network Traffic Exploration challenge at Hack the North 2025 handed over the MACCDC 2012 packet captures (17 compressed PCAPs and a 1.1 GB Suricata event log) and asked for tooling that helps an analyst map the network, find the most aggressive attacker and the most attacked defender, cut false positives and summarise what matters. Reading alerts by hand does not scale to that.
The approach
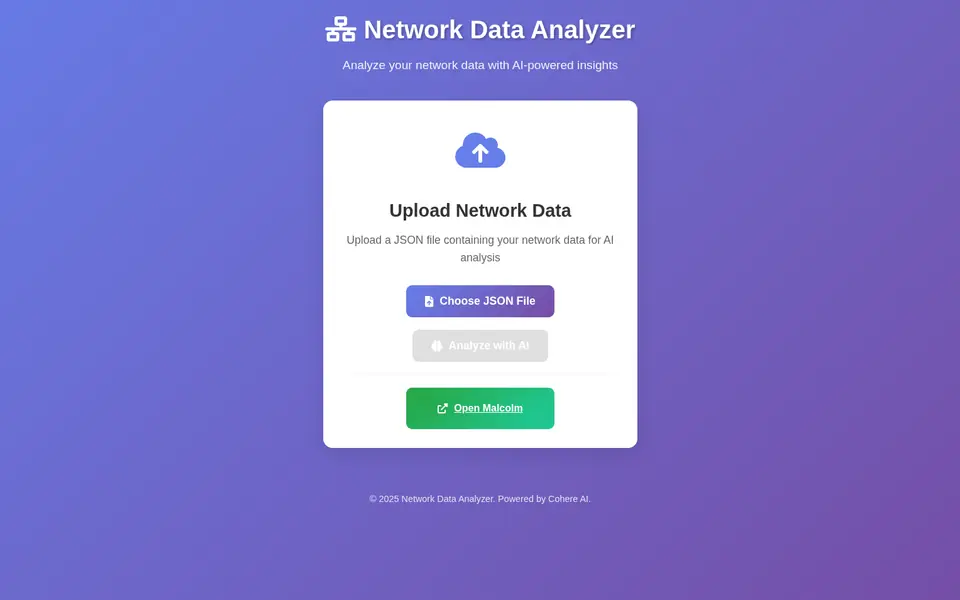
- The provided pipeline runs Suricata over every capture in a container and produces EVE JSON. Network Threat Explorer takes that JSON as its input: a Flask app loads it into an in-memory DuckDB with the JSON extension, flattens the nested alert, flow, HTTP and payload fields into columns, and hands pandas the frames for aggregation.
- The analytics report covers event types and protocols, the time range, unique sources and destinations, alert severities, top signatures and source IPs, destination ports outside the usual set, the hourly distribution and the top talkers by bytes.
- Anomaly detection layers several methods: an Isolation Forest on standardised features (hour, destination port, bytes each way, payload size, alert flag), z-score and interquartile-range outliers, DBSCAN noise points, a rolling-window check on hourly volumes, and plain rules for oversized payloads, scanner user agents such as nmap and sqlmap, ephemeral ports and the loudest 5% of sources.
- Cohere's command model writes the assessment. It never sees raw events, only a digest of the top-five lists, and is asked for a threat assessment, risk and behaviour analysis, recommendations and priority actions, rendered as HTML inside the report.
- The front end is plain JavaScript with Chart.js: five stat cards, a 24-hour event-type chart, the AI report and a download button, plus a link into a bundled Malcolm instance (Arkime, Zeek and OpenSearch) for packet-level digging.
The result
The tool took the CSE prize for Network Traffic Exploration at Hack the North 2025.
Built with
PythonFlaskDuckDBArkime
More case studies
- TraceUnsupervised anomaly detection that surfaced a hidden multi-stage attack in 180,800 unlabelled Apache log lines, then handed analysts an investigation console.
- MapleVaultSigned, hash-linked supplier attestations for Canadian defence procurement, with a verifier that computes Canadian content and catches forgery, tampering and replay.
- Land-cover segmentationWildfire-risk screening for British Columbia homes: segmentation models find buildings and vegetation in aerial imagery, and every parcel gets a FireSmart score.
- Agent²Your real estate agent's agent: text a number, take a short call with an AI voice agent, and get a matched listing back by SMS.